· 11 min read
Rate-distortion curves for LLM agents
Measuring LLM agents on quality, cost and latency at once, and why most of the findings are about the measurements rather than the models.
What I found trying to measure agents on three axes at once, and why most of the findings are about the measurements rather than the models.
Four questions this work attempts to answer:
- How do you choose a model for your application when one is better and another is cheaper?
- Should you trust the LLM judge scoring your agent’s output?
- Is this change a regression, or a trade-off somebody should decide on?
- Is the difference you are seeing real, or an artifact of how you measured it?
The first has a clean answer and the fourth turned out to be the hard one.
What this is: an open-source LLM evaluation harness in Python that reports agent quality, API cost and p95 latency together as a Pareto frontier rather than collapsing them into one benchmark score — with a calibration gate for LLM-as-a-judge scoring and a CI check that tells a genuine regression apart from a trade-off.
The idea, in one paragraph
Evaluations of LLM agents are usually reported as one number: “87% on the suite.” That number hides the two things that decide whether something can actually ship — what it costs and how long it takes. A configuration scoring two points higher for five times the money is not an improvement, but a single score records it as one.
Video compression settled this decades ago. No codec is judged on picture quality alone. It is judged on a rate-distortion curve — quality plotted against bitrate — and one codec beats another only when its curve sits above the other’s. The decision is made on the curve, never on a point.
This project applies that directly. Every configuration — a model, a prompt, an effort setting — becomes a point in (quality, cost, latency) space, and the three are never collapsed into one score. Model selection then happens on the curve, against whichever constraint actually binds for you.
Two words worth defining
Dominated. One configuration is dominated when another is at least as good on every axis and strictly better on at least one. There is no constraint under which you would pick the dominated one — something else beats it outright. That is a failure.
Trade-off. Two configurations where each wins on some axis and loses on another. Neither dominates. That is a result, not a tie to break — and the whole point is that a tool must not pretend to break it for you.
A real frontier
Four models, fifteen tasks, exact-match scoring so no judgement is involved. Total cost of the run: under one cent.
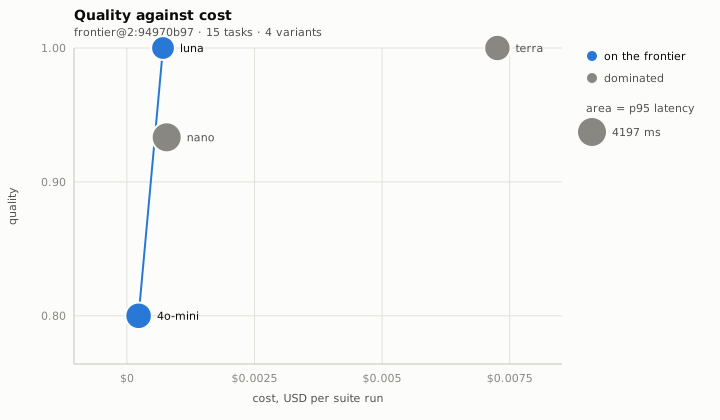
| variant | quality | cost | p95 latency | on the frontier |
|---|---|---|---|---|
nano (gpt-5-nano) |
0.933 | $0.00078 | 4197 ms | no |
4o-mini |
0.800 | $0.00023 | 2873 ms | yes |
luna (gpt-5.6-luna) |
1.000 | $0.00071 | 1992 ms | yes |
terra (gpt-5.6-terra) |
1.000 | $0.00726 | 2814 ms | no |
Read it as the tool does:
terrais dominated. It costs ten times whatlunacosts, scores exactly the same, and is slower. There is no budget under which it is the right choice here.nanois dominated. Worse on all three axes thanluna.4o-minisurvives despite the lowest quality, because nothing beats it on price. If your constraint is cost, it is the answer.lunasurvives on quality and speed.
A single quality score would have ranked these luna = terra > nano >
4o-mini and hidden the fact that one of the joint winners costs ten times the
other.
How it fits together
Five stages, each one persisting what it produced so the next never has to repeat it. Re-running costs money; re-reading does not.
suites/frontier/tasks.yaml
   variants:  model, prompt, max_tokens, effort, thinking, sampling params
   tasks:     input, scorer, expected answer
        |
        v
   runner ---- one request per (variant, task) ----> provider ----> model API
        |                                            ^ timed here, and only here
        |<--- text, tool calls, token counts, latency ---------------+
        |
        +-- price the tokens against a DATED table  --> cost
        +-- score the output with the task's scorer --> quality
        +-- append a raw row to results.jsonl          (always, as it lands)
        |
        v
   aggregate     quality = mean    cost = sum    latency = p95 (nearest-rank)
        |
        v
   one operating point per variant --> frontier --> report.md + frontier.svg
                                          |
                                          +-------> gate, against a committed
                                                    baseline, in CI
Parameters flow one way and are recorded at every step. A variant’s model, effort and sampling settings go into the request; the token counts and timing come back; the price table turns tokens into money at rates stamped with the date they were checked. The run manifest records all of it — suite fingerprint, price-table dates, every variant’s settings — because two frontiers are only comparable when those match, and the CI gate refuses outright when they do not.
Judged tasks take a detour. A scorer that needs a model cannot run inline, so those rows are written unscored and a separate, separately-billed pass fills them in:
run  -->  rows with score = None
              |
              v
   pareto-eval judge   -->  judgements.jsonl  (the judge's own cost, never the
              |                                variant's)
              v
   calibration.json  <--  pareto-eval calibrate  <--  human-labelled items
              |
              v
   aggregate refuses unless the calibration matches this judge, this prompt,
   this label set -- and says which verdict licensed the number
That last box is the unusual part. Without a passing calibration there is no operating point at all — not a number with a warning beside it.
Findings
Most of what I learned was about the difficulty of measuring, not about the models. These are the ones that changed the tool.
1. The eval was wrong before the models were
The first run of that suite had all four models failing the same task. I had asked how many times “r” appears in “strawberry regatta” and asserted the answer was 5. It is 4. Three of the four models answered correctly and were marked wrong.
A unanimous failure is nearly always a broken task, not four broken models. The suite is versioned data with a content hash, so fixing it forced a version bump, and the two runs are not comparable — which is the behaviour you want.
2. Running order biases the latency axis
Two configurations that were provably identical — same model, same tokens, same cost — measured 1582 ms and 938 ms. The difference was that one ran first.
Pooled over three runs: first slot 1396 ms, second slot 944 ms. Reversing the order flipped which configuration the tool called dominated. Discarding a warm-up call before measuring reduced the effect without removing it.
So the tool now refuses to fail a build on a latency-only difference. That is an honest gate with a real cost: a genuine latency regression would pass. The three-axis gate is a two-axis gate until running order is fixed.
3. Models are not deterministic even when you do not ask for randomness
Same model, same task, same prompt, no sampling parameters set. Two runs, twelve minutes apart:
run 1:  luna answered '3'
run 2:  luna answered '4'
The tool does warn about this — but only when you asked for it. Set temperature above zero and the report says the numbers will move between runs. Here temperature was never set, so nothing was flagged, and the numbers moved anyway.
The warning is a floor, not a guarantee: it catches randomness that was requested, not randomness that happened. So comparing any two runs is partly comparing two rolls of the dice, whether or not the report says so.
4. An LLM judge preferred whichever answer it saw first
Jargon: an LLM judge is a model asked to grade another model’s output, because most interesting outputs cannot be checked with string matching.
I gave a judge 597 pairs of responses and asked which was better. Then I showed it the same 597 pairs with the two responses swapped.
| picked whichever response came first | |
|---|---|
| original order | 60.6% |
| swapped order | 58.3% |
A judge with no positional preference would have those two sum to about 100%. They sum to 118.9%. On 22.3% of pairs it reversed its preference purely because the two answers changed places.
Telling it not to — the prompt literally said the order must not influence the decision — made it slightly worse, not better.
5. A better judge does not fix it, and a dearer one may be worse
Four judges, same 199 pairs, both orders, about $1.25 total.
| judge | agreement with humans | flipped on swap | positional excess |
|---|---|---|---|
| gpt-5.6-terra | 0.677 | 47.7% | +9.0% |
| gpt-5.6-luna | 0.661 | 49.7% | +21.1% |
| gpt-5-mini | 0.645 | 50.3% | +14.6% |
| gpt-5.4-mini | 0.430 | 53.8% | −30.7% |
The best judge cost ten times the cheapest and bought 0.016 of agreement.
gpt-5.4-mini is dearer than luna and much worse — and biased the opposite
way, preferring the second answer by 31 points.
Price does not predict judge quality. Chain-of-thought prompting, the standard recommendation, bought about the same as a ten-times-dearer model: 0.020.
6. A published benchmark’s headline number could not be reproduced
Jargon: Cohen’s kappa is the standard measure of inter-annotator agreement — how much two people agree, corrected for how much they would agree by chance alone. If 90% of answers are “pass”, a grader who says “pass” every time gets 90% raw agreement and a kappa near zero — correctly identifying it as useless.
NVIDIA’s Judge’s Verdict paper reports a human-to-human baseline of kappa 0.801, computed over 1,994 items. The released dataset contains annotations for 200 of them. Running our own calculation over the released 200 gives 0.410 to 0.523 depending on the weighting. Nothing lands near 0.801.
This is not misconduct. The released subset is one domain of six, plausibly the hardest, and the paper’s code claim (“scripts for fetching source data and evaluating LLM judges on the full dataset”) checks out — that code is there. What is not there is the analysis that turns judge scores into the paper’s statistics, and the annotations behind the number were not published.
The data is what binds, not the code. The statistics took an afternoon to reimplement. The missing annotations are not recoverable at any effort.
7. The dataset that looked perfect for the job had been filtered
This is the one I would most want someone else to know.
NVIDIA’s HelpSteer3 has everything a calibration set appears to need: 38,459 items, three annotators each, an ordinal scale, a permissive licence. Every judge I measured against it failed by twenty to fifty standard deviations. That seemed like a devastating result about LLM judges.
Then I noticed the judges agreed with a human about who won roughly 80% of the time — the figure the literature reports for good judges. Those two facts do not fit together.
Checking the humans:
| all three annotators picked the same winner | 98.8% |
| human-human agreement (kappa) | 0.980 |
Genuine human agreement on subjective preference runs nearer 80%. The dataset card explains it:
Every sample was independently annotated by a minimum of three annotators and up to five annotators… We release only the three annotations that agree with one another the most to remove outliers
That is selecting on the thing being measured. The annotations were collected independently; the released three were then chosen for agreeing. For training a reward model — what the dataset is for — dropping outliers is reasonable. For measuring how much annotators disagree it is fatal, because disagreement is exactly what was removed.
I had blamed the statistic. Without that 80% figure contradicting the verdict, I would have “fixed” a gate that was working correctly against a standard built to be unreachable.
Label sets now have to declare how their annotations were produced, and
calibration refuses anything not marked independent. unknown is the default
and is not treated as a synonym for fine.
8. A widely used framework has 45 judge metrics and no way to check any of them
DeepEval has 17,700 stars and 45 metric families. Searching all 2,542 files:
| concept | files |
|---|---|
| kappa | 0 |
| calibration | 0 |
| agreement / inter-rater | 0 |
| correlation | 0 |
| latency | 0 |
| cost | 1 (a tracing test schema) |
It is a better test framework than this project will ever be. But it ships 45 LLM judges and nothing that tells you whether any of them agrees with a human on your data.
Limitations
The honest list, because most of this project is a record of measurement being harder than it looks.
The calibration gate is easier to argue for than to use. It needs at least three genuinely independent human raters. Both public datasets I tried failed — one unreproducible, one filtered for agreement. Producing your own labels is the only route, and the sampling maths says roughly 600 items × 3 raters for the comparison to mean anything, not the ~50 I had planned.
One statistic is fragile at both ends. The gate compares a judge to how much the humans vary among themselves. With three raters you get three comparisons — and more items never add more. Too few items and that spread inflates with noise; over-consistent raters and it collapses. Both times the underlying agreement numbers were fine and the comparison was nonsense. The tool now reports the verdict and hides the magnitude.
Latency cannot fail a build. See finding 2. Correct, and it means the third axis is currently decorative in CI.
Quality via a judge is blocked. Without labels there is no calibration, so a judge-scored run produces no result at all. That is the gate working, and it means the demo above uses exact-match scoring.
A judge grading models from its own vendor may favour them. Calibration cannot detect this, because calibrating never asks a judge to choose between candidates. The tool declares the conflict and declines to act on quality differences where it applies. It does not correct for it.
The frontier above is fifteen tasks. p95 latency on fifteen samples is nearly the maximum. It demonstrates the machinery; it is not a benchmark.
What I would tell someone starting this
Instrument your instrument first. Every real finding here came from measuring the measuring apparatus — swapping the order, running it twice, checking the humans. None came from the models.
A unanimous result is a bug report about your test.
“We use an LLM judge” is not a methodology. It is the start of one. The question is whether that judge agrees with a person on your data, and almost nothing in the ecosystem helps you answer it.
Regression testing for an agent is not a threshold on one score. The useful question is not “did quality drop” but “did this fall behind the curve we already had” — and the answer has three states, not two: beaten outright, a trade someone has to accept, or a difference the instrument cannot support.
Refuse rather than warn. A warning is read exactly when it does not matter. Every gate here either blocks or explains why it declined to — there is no middle state where a number is reported next to a caveat nobody reads.
Also published on Medium.